
VnStat PHP: A Web Based Interface for Monitoring Network Bandwidth Usage
VnStat PHP a graphical interface application for most famous console mode network logger utility called “vnstat“. This VnStat PHP is a graphical frontend to VnStat, to view and monitor network traffic bandwidth usage report in nicely graphical format. It display IN and OUT network traffic statistics in hourly, days, months or full summary.
This article shows you how to install VnStat and VnStat PHP in Linux systems.
VnStat PHP Prerequisites
You need to install the following software packages on your system.
- VnStat : A command-line network bandwidth monitoring tool, must be installed, configured and should collect network bandwidth statistics.
- Apache : A Web Server to serve web pages.
- PHP 5 : A server-side scripting language for executing php scripts on the server.
- php-gd extension : A GD extension for serving graphic images.
Step 1: Installing and Configuring VnStat Command Line Tool
VnStat is an command line network bandwidth monitoring utility which counts bandwidth (transmit and received) on network devices and keeps the data in its own database.
Vnstat is a third party tool and can be installed via enabling epel repository under Red Hat based systems. Once you’ve enabled, you can install it using yum command as shown below.
On RHEL/CentOS and Fedora
# yum install vnstat
On Debian/Ubuntu and Linux Mint
Debian user’s simply apt-get to install
$ sudo apt-get install vnstat
As I said Vnstat maintains its own database to keep all network information. To create new database for network interface called “eth0“, issue the following command. Make sure to replace interface name as per your requirements.
# vnstat -i eth0

Error: Unable to read database "/var/lib/vnstat/eth0".
Info: -> A new database has been created.
If you get above error, don’t worry about such error, because you are executing the command first time. So, its creates new database for eth0.
Now run following command to update all enabled databases or only specific interface with -iparameter as shown. It will generate traffic statistics of IN and OUT of a IN and OUT of a eth0 interface.
# vnstat -u -i eth0
Next, add a crontab that runs every 5min and update eth0 database to generate traffic statistics.
*/5 * * * * /usr/bin/vnstat -u >/dev/null 2>&1
Step 2: Installing Apache, Php and Php-gd Extension
Install the following software packages with the help of package manager tool called “yum” forRed Hat based systems and “apt-get” for Debian based systems.
On RHEL/CentOS and Fedora
# yum install httpd php php-gd
Turn on Apache at system start-up and start the service.
# chkconfig httpd on
# service httpd start
Run the following “iptables” command to open Apache port “80” on firewall and then restart the service.
# iptables -A INPUT -m state --state NEW -m tcp -p tcp --dport 80 -j ACCEPT
# service iptables restart
On Debian/Ubuntu and Linux Mint
$ sudo apt-get install apache2 php5 php5-gd
$ sudo /etc/init.d/apache2 start
Open port 80 for Apache.
$ sudo ufw allow 80
Step 3: Downloading VnStat PHP Frontend
Download latest VnStat PHP source tarball file using “wget command” as shown below or visitTHIS PAGE to grab latest version.
# cd /tmp
# wget http://www.sqweek.com/sqweek/files/vnstat_php_frontend-1.5.1.tar.gz
Extract the source tarball file, using “tar command” as shown given.
# tar xvf vnstat_php_frontend-1.5.1.tar.gz
Step 4: Installing VnStat PHP Frontend
Once extracted, you will see a directory called “vnstat_php_frontend-1.5.1“. Copy the contents of this directory to web server root location as directory vnstat as shown below.
On RHEL/CentOS and Fedora
# cp -fr vnstat_php_frontend-1.5.1/ /var/www/html/vnstat
If SELinux enabled on your system, run the “restorecon” command to restore files default SELinuxsecurity contexts.
# restorecon -Rv /var/www/html/vnstat/
On Debian/Ubuntu and Linux Mint
# cp -fr vnstat_php_frontend-1.5.1/ /var/www/vnstat
Step 5: Configuring VnStat PHP Frontend
Configure it to match your setup. To do open the following file with VI editor and change the parameters as shown below.
On RHEL/CentOS and Fedora
# vi /var/www/html/vnstat/config.php
On Debian/Ubuntu and Linux Mint
# vi /var/www/vnstat/config.php
Set your default Lagrange.
// edit these to reflect your particular situation
$locale = 'en_US.UTF-8';
$language = 'en';
Define your network interfaces to be monitored.
// list of network interfaces monitored by vnStat
$iface_list = array('eth0', 'eth1');
You can set custom names for your network interfaces.
// optional names for interfaces
// if there's no name set for an interface then the interface identifier.
// will be displayed instead
$iface_title['eth0'] = 'Internal';
$iface_title['eth1'] = 'External';
Save and close the file.
Step 6: Access VnStat PHP and View Graphs
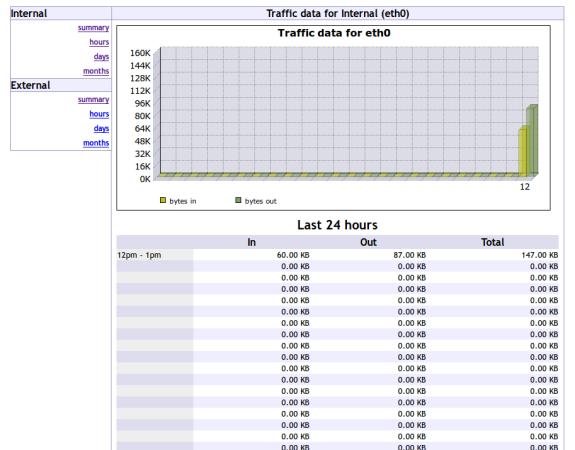
Open your favourite browser and navigate to any of the following link. Now you will see a fancy network graphs that shows you a summary of network bandwidth usage in hours, days andmonths.
http://localhost/vnstat/

http://your-ip-address/vnstat/
Sample Output
Reference Link
